Product Analyst Technical Task Explained

This article will break down the technical task for Product Analyst position at Kaspi.kz. Generally speaking this company is the bank owned Superr App originated from Central Asia which provides Peer to Peer Instant Money Transactions, Marketplace, Flight Tickets Booking, Classified Advertising, and even wide range of Government Services from Municipal Fines and Fees to Incorporating a Company.
According to the job description Product Analyst should assist to Product Manager in defining metrics by analyzing the user behaviour. For that purpose, not only the list of hard-skills such as Statistics, SQL, Python are required, but also the basic principles of Product Management is crucial. The latest is actually the only thing that distinguish the Product Analyst from the Data Scientist or Data Analyst and the rest of the gang. So let's see what it's all about.
Task 1
Choose any popular web or native application and imagine that you are launching your own APP with the same business model. Now build a dashboard for keeping track of overall APP performance.
This task is all about your strategic vision! Whatever app you'd choose it tells a lot about your interests, background and experience. Personally I'd choose the B2C and C2C marketplace sort of like Alibaba's taobao example.
As the internaional student in China I used that product a lot. Also I currently work in marketplace such as the taobao, so that would be the perfect one for me. I'll use excalidraw to draw a simple dashboard.
1.1 The Buyers Overview
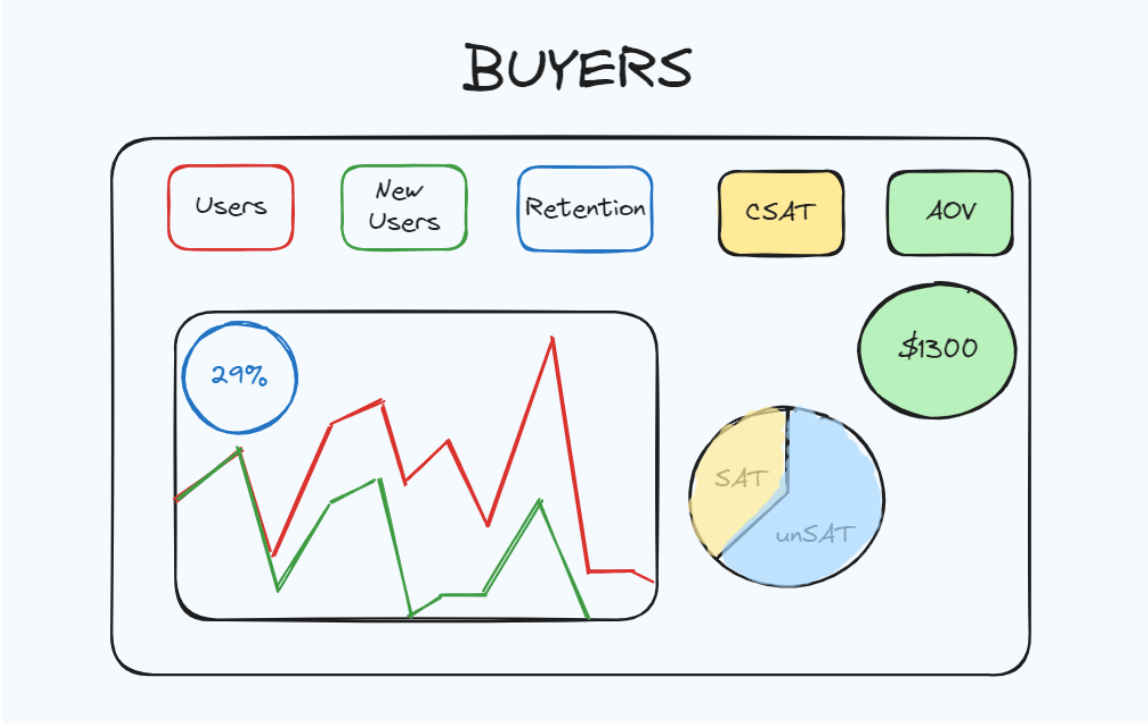
The buyers overview shows you overall descriptive business sense of your APP. It's the amount of total Users, the amount of New Users who visited the App for the first time, as oppose to the Retention, that shows you the percentage of those who visiting the APP more than once. The CSAT, which stands for Customer Sattisfaction shows you the percentage of sattisfied users, and the AOV or Average Order Value, meaning the average paycheck your users spend in your APP. That's the basic line for business performance evaluation. Doesn't matter what you do with your APP, this metrics will signal to you if you do it right or wrong way.
A little side note. If you ever filled the form such as:
How would you rate your sattisfaction level of our services?
- Very Unsattisfied
- Somewhat Unsattisfied
- Neutral
- Somewhat sattisfied
- Very Sattisfied
Then you did contribute to the CSAT metric, and if your answer lies between 1 and 3, then you votted being not sattisfied, otherwise votting for 4 and 5 would count you as the sattisfied user.
1.2 The Funnel Overview
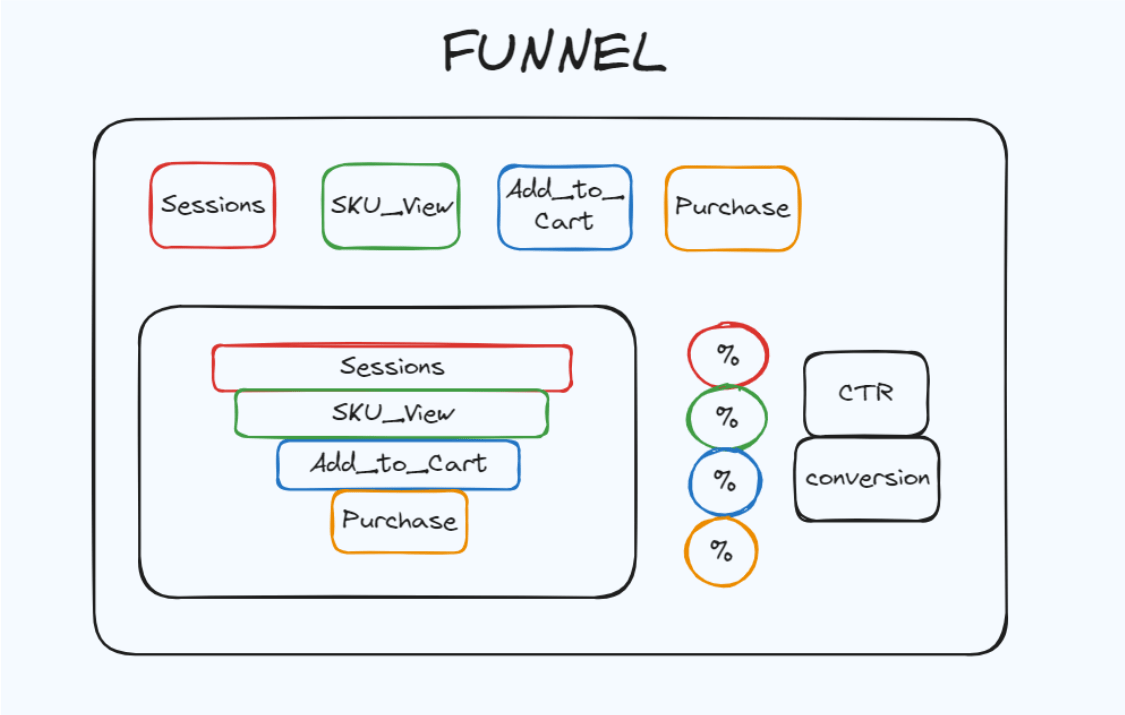
The funnel overview would show you at what stage your users bounces out of the funnel. This is usually done with the web analytics tools such as Google Analytics 4 or Amplitude. The web analytic tools allows you to track your custom events like user viewing an Item Page. Then you compare how many Users logged-into the session and viewed items on the marketplace, the next event is probably tracking the percentage of those who added the item to the cart, and eventually track the percentage of users that actually bought something, and that's how you calculate the conversion rate between the events, and by default the conversion calculates from top to bottom of the events, but it may depend on the task you working on.
Since the numbers are getting smaller on each stage, assuming that users generally following a certain path from main page to the purchase, which is by the way not always true, cause sometimes users following a direct link breaking the funnel logic, but in general the event where you loose the most percentage of your traffic is the event that you should be focusing your diagnosis analysis on. It's very common for a marketplace to have a conversion rate from session to the purchase to be as small as 1% - 3%. And that's also very basic charts for a Product Management, so being fammiliar with the funnels helps a tone.
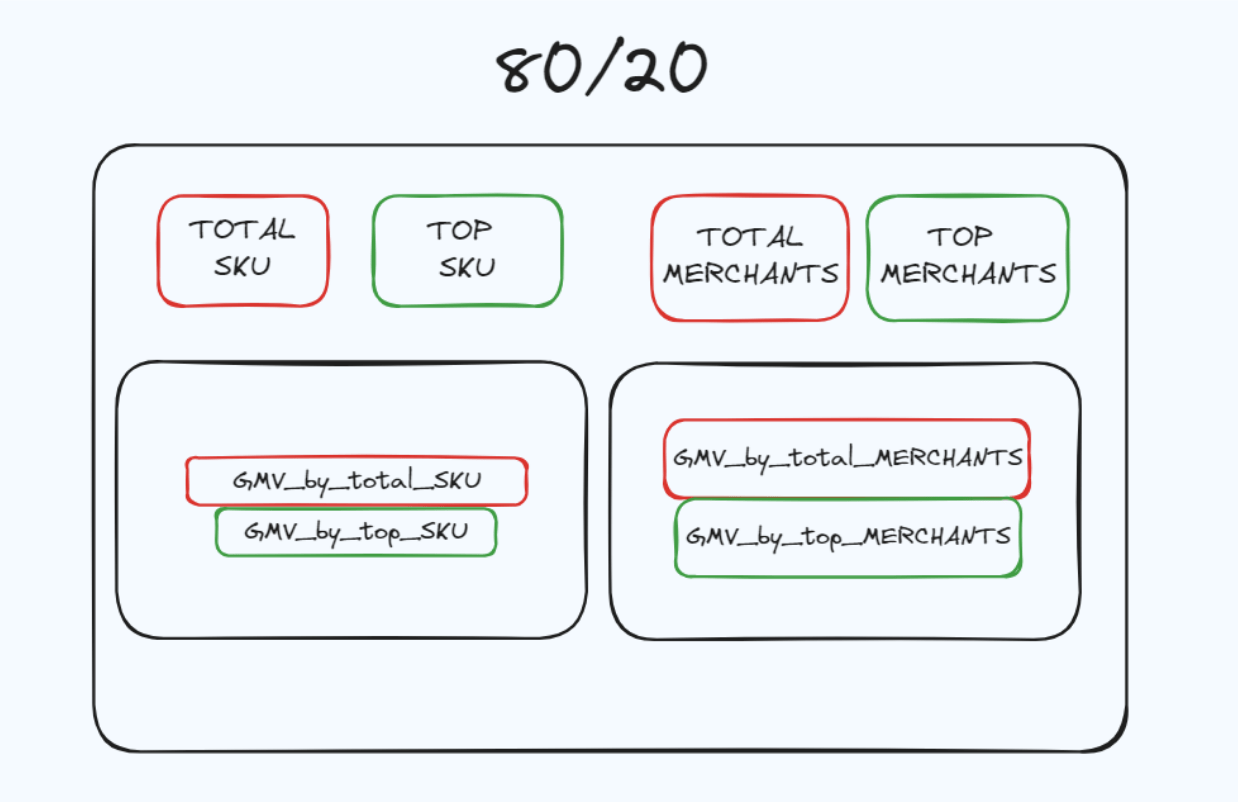
1.3 Items and Sellers Selection
Having a numbers on a dashboard is good, but what do you do when they are not meeting your targets. Then it's a good idea to descend down the level of your business concept and come-up with customer story. In case of marketplace, your customer story might sound like:
"I want to buy a product, so I open this APP to look for it. Is there what I'm looking for? Is there many alternatives to what I'm looking for?"
To answer this abstract and general user question we will evaluate our supply substances which are the items and sellers or so-called SKU and Merchants by generated revenue. The Parreto principle is a good reference for a supply-side concentration analysis, either top SKU or top Merchants that generates 80% of the revenue should be at least 20% from total SKU or Merchant amount. If Pareto principle is not sattisfied, then neither your client story. That's an exapmle of diagnosis analytics.
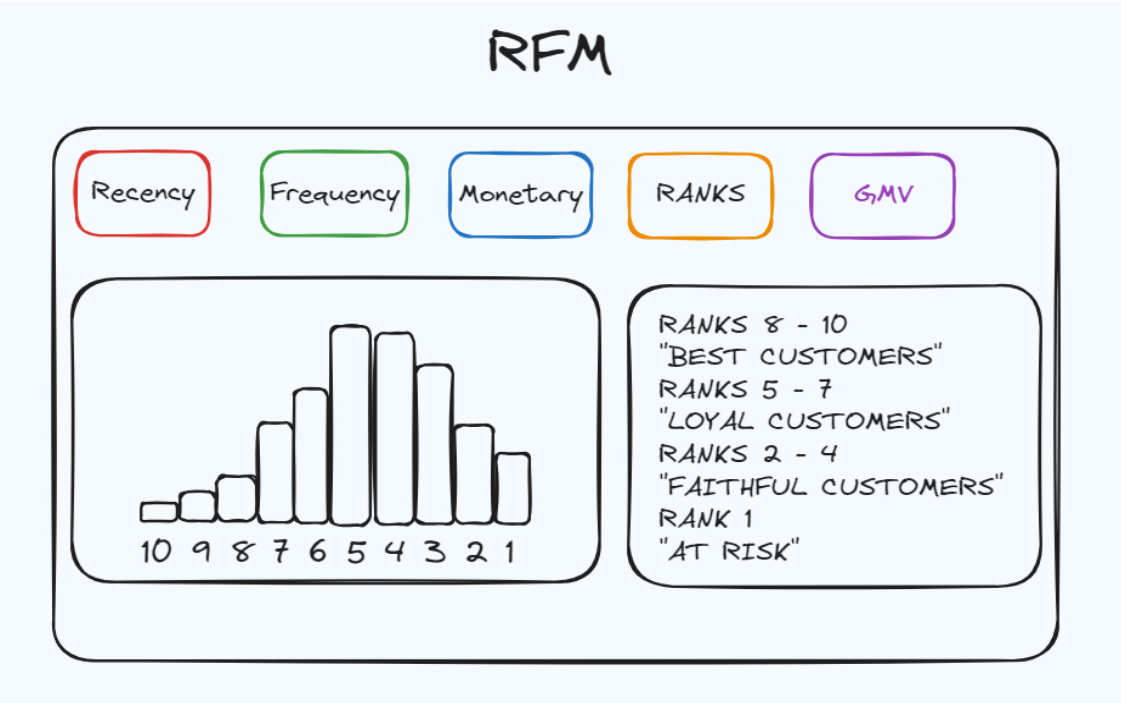
1.4 Customer Segmentation Overview
This is where the analytics gets more advanced, cause that takes you to the prescriptive analysis. When having a big customer base, it's crucial to have a different or rather personal approach for the marketing touch. Also you can be very prejudice and provide different service level, depending on how important a certain customer to your revenue.
The RFM analysis ranks your customer base over three different attribute such as Recency, Frequency and Monetary, basically you take your total user amount and divide them into 10 groups by each attribute:
- How recent they been active using your APP
- How frequently they been active using your APP
- How much revenue they been generating using your APP
You end-up with three different scoring models with ranks from 1 to 10 for each customer. You add the scores for each client and divide that by 3 getting the total RMF score, and that helps you to segment the customers. How exactly you should segment your customer base totally depends on your specific business model. But in general you need to find out customers that are sensitive to the price and attract them using promotions whereas big spender customers should be attracted with more privilege offers.
Task 2
Given the following ideas for increasing the conversion rate from service page to contact, help your Product Manager on Classified Advertisement Services to prioritize the experiments. Also pick at least one idea and provide the preliminary experiment design
This task would evaluate your communication skills, including your attention to details and ability to ask right questions and clarifying the given information.
Idea A
The rating and review blocks. Making rating and review blocks available on the listing page and service card may increase the conversion rate.
Idea B
The subscription feature. Giving the users an option to subscribe to any service and being notified when new one being added to the platform would increase conversion rate.
Idea C
The service booking feature. Giving the users an option to directly book the service on the APP would increase the conversion rate from service page to contact.
Idea D
The working hours block. Adding the working hours to the service card would increase the coversion rate.
2.1 Answering via E-mail to the Product Manager
Dear John Doe,
Idea A sounds good to me! Let's add it to the current sprint. It seems to be easy to execute, and I'm very confident on the impact, cause every users should be able to see the recomendation block on the listing page. I'd provide the A/B test design by the end of the day, so we can run it tomorow.
Idea B sounds easy to implement, however I'm uncertain on how many users actually need this feature. It doesn't seems like users tend to search the same service over and over again. However if the development side is ready to implement, then this experiment also might go into the backlog on this week.
Idea C sounds cool! Does this feature should be integrated into suppliers CRM? If online booking feature is available on the listing page then there is a big confidence that it might boost the conversion rate, but we have to be certain that it will be ready anytime soon, otherwise let's postpone it to the next sprint.
Idea D in my opinion may decrease the conversion rate, cause it makes clear whether the working hours suit your needs or not. But if you insist, it still very easy to implement so we can run the test on this week.
Let's discuss with the rest of the team, but I'd suggest to prioritize ideas in the following order A -> C -> B -> D.
Yours,
Bad Dog
2.2 The Experiment Design Example for Idea A
Experiment Objectives:
Determine whether the new reviews and rating blocks on the listing page, and service card has or has not significant increase on conversion rate by at least 5%
H0: New blocks does not increase conversion rate from service page to contact
H1: New blocks does increase conversion rate from service page to contact
A/A test groups:
Preliminary experiment to identify two identical groups for comparability. Both groups receiving identical interface, and that ensures randomization in user selection for each group, making sure that any difference in A/B test would happened due to recent changes.
Group A_1: control group
Group A_2: experimental group
The A/A test duration time should be as much as needed for collecting required sample size.
A/B test groups:
The main experiment, where the control group A (ex A_1) receives a standard interface, and the experimental group B (ex_A2) additionally receives new blocks of reviews and rating on the listing page and service card.
Group A: control group
Group B: experimental group
The A/B test duration time should be at least 7 days, preferably even 14 days. The duration time in scope of entire weeks helps to properly assess the impact of weekend and working days alike.
Metrics to be tracked during experiment:
- Conversion Rate - the ratio of contact page visits to the service card visits
- ARPPU - average revenue per user
- AOV - Average Order Value
- CTR to service card - Clicks from listing page to service card
- CTR to contact page- Clicks from the service card to contact page
Calculating sample size using R:
library(pwr)

p1 <- 0.0121 # Current conversion rate - 1.21%
p2 <- 0.0127 # Set target + 5% conversion to 1.27%

alpha <- 0.05 # Set the Confidence Interval to 95%
beta <- 0.20 # Set the power to 80% (1 - beta)

z_alpha <- qnorm(1 - alpha/2)
z_beta <- qnorm(1 - beta)

sample_size <- pwr.2p.test(h = ES.h(p1, p2), sig.level = alpha, power = 1 - beta)

sample_size
Sample size:
1,067,834 observations in total or 533,917 observations per sample
Task 3
According to given table calculate the Monthly Active Users for the October
| A | B | C | MAU |
|---|---|---|---|
| year_month | new_users | retention_rate | - |
| 1/1/2023 | 12000 | 100 | - |
| 2/1/2023 | 11500 | 0.2053 | - |
| 3/1/2023 | 10000 | 0.1812 | - |
| 4/1/2023 | 17000 | 0.1715 | - |
| 5/1/2023 | 14350 | 0.1595 | - |
| 6/1/2023 | 12200 | 0.144 | - |
| 7/1/2023 | 11100 | 0.14 | - |
| 8/1/2023 | 14784 | 0.14 | - |
| 9/1/2023 | 13347 | 0.14 | - |
| 10/1/2023 | 20220 | 0.14 | - |
3.1 Calculating MAU
Assuming that the given APP has been launched in January 2023, then MAU for January should be equal to the amount of new users, then for the february you'd need to multiply previous month MAU on the current retention rate and add the new users in the way like following excel formula would calculate it for you.
| Month | New Users | 20,53% | 18,12% | 17,15% | 15,95% | 14,40% | 14% | 14% | 14% | 14% | MAU |
|---|---|---|---|---|---|---|---|---|---|---|---|
| January | 12000 | 2464 | 2174 | 2058 | 1914 | 1728 | 1680 | 1680 | 1680 | 1680 | 12000 |
| February | 11500 | 2361 | 2084 | 1972 | 1834 | 1656 | 1610 | 1610 | 1610 | 13964 | |
| March | 10000 | 2053 | 1812 | 1715 | 1595 | 1440 | 1400 | 1400 | 14535 | ||
| April | 17000 | 3490 | 3080 | 2916 | 2712 | 2448 | 2380 | 23195 | |||
| May | 14350 | 2946 | 2600 | 2461 | 2289 | 2066 | 23538 | ||||
| June | 12200 | 2505 | 2211 | 2092 | 1946 | 23504 | |||||
| July | 11100 | 2279 | 2011 | 1904 | 24051 | ||||||
| August | 14784 | 3035 | 2679 | 29176 | |||||||
| September | 13347 | 2740 | 29913 | ||||||||
| October | 20220 | 38625 |
The MAU for October 2023 should be equal to 22 414 users. But we are not just a aregular excel users, don't we. Let's predict the MAU for the next year using forcasting model Prophet
3.2 Predicting MAU
Let's create a plot using Facebook's library for timeseries analysis called prophet. Install the package running the following code
install.package("prophet")
Then run the following code, assuming we have our table in the working directory named as 'input.csv', and rename year_month and MAU columns to ds and y respectively.
# Load the library
library(prophet)

# Read data from CSV file
df <- read.csv('input.csv')

# Convert it to Date
df$ds <- as.Date(df$ds)

# Initialize the prophet model
m <- prophet()

# Fit the model
m <- fit.prophet(m, df)

# Create a dataframe for future dates
future <- make_future_dataframe(m, periods = 12, freq = "month")

# Predict MAU for future dates
forecast <- predict(m, future)

# Plot the forecast
plot(m, forecast)
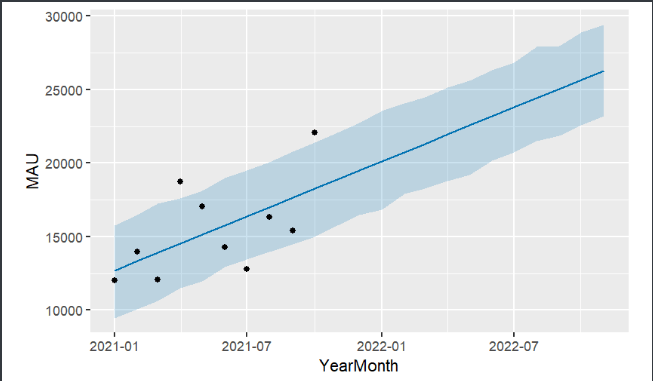
On the plot the black dots representing the actual values, the straight blue line is the model predicted values, and the lightblue area is the 96% confidence level of prediction accuracy. According to this model, we are likely to exceed 25 000 MAU by the end of the year.
Conclusion or What Could be Done Differently
I really enjoyed completing this technical task, except maybe writing SQL statements, that's why int's not included in the article. However there is a few things that could have been done differently.
- The Dashboard metrics could be organized in the North Star or MECE framework
- The email answer to John Doe could mention the affect on the key metrics
- The A/B test design could contain the Client Story and Problem
- The MAU calculation might have take into account the retention for each month as a cohort, thus MAU for October is equal to 38 625
| Month | New Users | 20,53% | 18,12% | 17,15% | 15,95% | 14,40% | 14% | 14% | 14% | 14% | MAU |
|---|---|---|---|---|---|---|---|---|---|---|---|
| January | 12000 | 2464 | 2174 | 2058 | 1914 | 1728 | 1680 | 1680 | 1680 | 1680 | 12000 |
| February | 11500 | 2361 | 2084 | 1972 | 1834 | 1656 | 1610 | 1610 | 1610 | 13964 | |
| March | 10000 | 2053 | 1812 | 1715 | 1595 | 1440 | 1400 | 1400 | 14535 | ||
| April | 17000 | 3490 | 3080 | 2916 | 2712 | 2448 | 2380 | 23195 | |||
| May | 14350 | 2946 | 2600 | 2461 | 2289 | 2066 | 23538 | ||||
| June | 12200 | 2505 | 2211 | 2092 | 1946 | 23504 | |||||
| July | 11100 | 2279 | 2011 | 1904 | 24051 | ||||||
| August | 14784 | 3035 | 2679 | 29176 | |||||||
| September | 13347 | 2740 | 29913 | ||||||||
| October | 20220 | 38625 |
I always find SQL super boring in technical tasks, cause there is no sufficient reward, whereas in the real life extracting the right data would create the fuel for your model, dashboard or whatever data product you might need.
However if you are interesting in learning SQL, which is crucial for Data kinda jobs. I'd highly recommend the free resources by DataAcademy. This is a clean content without any ads or payment subscriptions. So definitely check this out!
Yours,
Bad Dog