Building Data Warehouse in Activity Schema with ClickHouse

"It doesn't matter who you hire first, whether it's a Data Scientist, Data Analyst, or ML Engineer. The first hire eventually would do Data Engineering job."
-- Random Guy from LinkedIn
I learned about Activity-Schema when applied to a Data Engineering role at the company that do Data Analysis as a Service and they work with a lot of data, so the technical task was to implement an Activity-Schema and build a Data Pipeline. This article would introduce Activity-Schema for Data Warehousing and how to build one using ClickHouse, so let's kick off.
Understanding Data Warehouses vs Traditional Databases
When it comes to work with data, we've got two essential storage types: the Traditional Database, that keeps the day-to-day transactions and handles so called OLTP or On-Line Transactional Processing in smooth operation. For instance you open your bank APP to check your balance. You go through authentication first, so the APP understands your identity. Then, you click to the balance page, and for the given authentication ID, the APP retrieves your balance exactly, rather than someone else's.
The OLTP Database is essential for any web application to perform CRUD operations as fast as possible. On the other hand imagine that you are a new recruit as a BI Analyst at random company. You ask what Data Storages we have, and your manager answers - "oh yeah, there is one called Oracle", and this is the moment where you should realize that you screwed-up.
The reason you screwed up is that OLTP databases, as good as they are for keeping your product up and running, are not optimized for data analysis at all. Therefore, you're either forced to work in a non-optimized environment or you have to build one yourself.
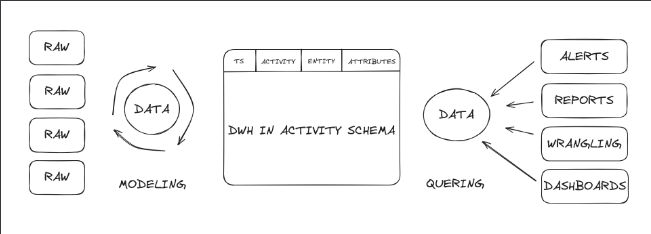
And the only good news is that you are reading exacty right article to build OLAP or On-Line Analytical Processing storage or so-called Data Warehouse that is optimized for Data Analysis, and for that purpose we would not use a traditional Star-Schema, but rather a relatively new concept called Activity-Schema.
Why not to use a Star Schema
So what is the schema in the first place? When working with Databases you have a certain architecture of tables and how they are related to one another. And it's usually a matter of scale, but at the simplest example of Star-shema would look like this
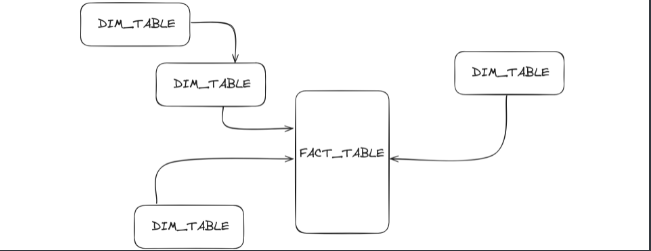
Fact table is a transactional table that per say accumulates order records, and Dimension tables are the one that feeds Fact tables with a nuances like the client's personal data, the delivery address, and litteraly anything else. It's get more complex when you start generating a Primary and Foreign keys that are used to link tables, and even the links themself has to be further defined as one-to-many or many-to-many relationships and considering that orders is just one out of infinite fact tables that business may operate, this schema is getting complex.
The complexity of such architecture is called normalization. The more tables and relationships between them, the more normalized your data infrastructure becomes. And it works well in OLTP. But if you want to query a DataFrame with millions of rows and make further analysis on it, that would be a painful experience to identifing Primary and Foreign keys and writing a complex SQL statement with a lot of dependencies taking into account. And that's my hermano is not bueno.
So, in order to optimize such normalized infrastructure for analytics, you have to reverse engineer its architecture and denormalize it. You don't have to be an IT architecture guy to do that, and that's where Activity-Schema comes into play.
So what is Activity Schema and why to use it
Activity-Schema in contrast to the Star-Schema doesn't have Primary-Foreign key realationships and any other dependencies for a one good reason. It has only one single table complying with "One-Big-Table" schema, but instead of dimension tables it has the nested key/value column.
If you read the official documentation, then this column is called "Feature", However, for some reason, I call it 'Attributes'. It doesn't really matter how you call this column. In the end, it's not the name but the data type that is crucial. As you may see, the value in this column may be reminiscent of JSON, but in fact if you are going to follow this guide we will use a ClickHouse's map() Data Type instead of something like jsonb in Postgres for example.
This approach is one of the most denormalized since we have no dependencies between the tables, in fact the only join that is possible with Activity-Schema is the self-Join. This table is going to be enormous, and for that reason you should consider a column-oriented database that is optimized to carry-out big amount of data like DuckDB or ClickHouse.
Set-up your ClickHouse
For the sake of simplicity, we will use our local machine in this tutorial, whereas in the real world the Data Warehouses should be deployed somewhere in the cloud, but with this in mind let's assume that our laptop is the powerful on-premise server, and just for this purpose it's happened to be that my laptop is running on Linux. If you are a Windows guy, then my previous article on how to coding, where I've include the installation of WSL2 or Windows Subsystem for Linux would help you to keep up with this guide.
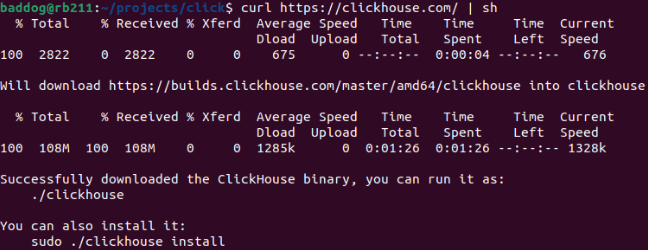
curl https://clickhouse.com/ | sh
With the power of the Terminal, hit the above bash command, and that should download a ClickHouse client for you. It will take a while to download, and then it should display "Successfully Downloaded".
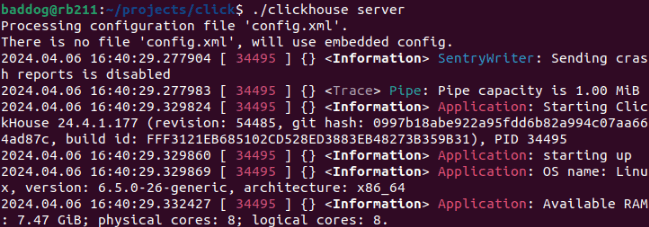
Your next move after installation is to run the ClickHouse Server with the following command.
./clickhouse server
Then open a new terminal where you will run the ClickHouse Client
./clickhouse client
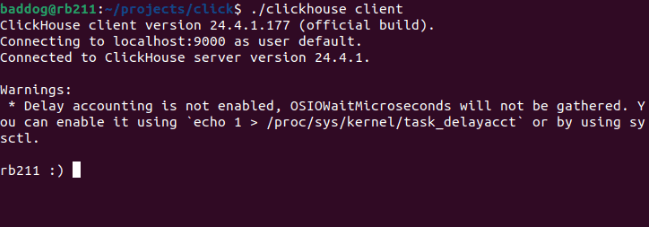
I'm not even trolling, the ClickHouse command lines has a smile face as the cursor, isn't it fun? The next ClickHouse commands should be run on the Client side to communicate with your Server. Let's create a database and name it 'activity'.
CREATE DATABASE activity
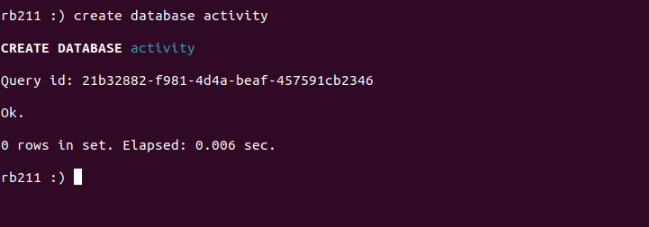
This indicates a successful database creation. Now let's create the stream table and define each column and it's Data Types. And as mentioned before, we going to use Map Data Type for attributes column.
CREATE TABLE activity.stream (
    timestamp DateTime,
    activity_id UUID,
    activity String,
    entity String,
    attributes Map(String, String)
) ENGINE = MergeTree()
ORDER BY timestamp;
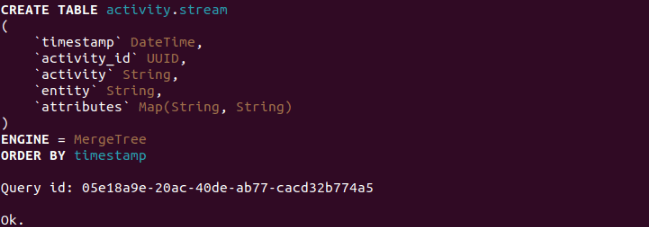
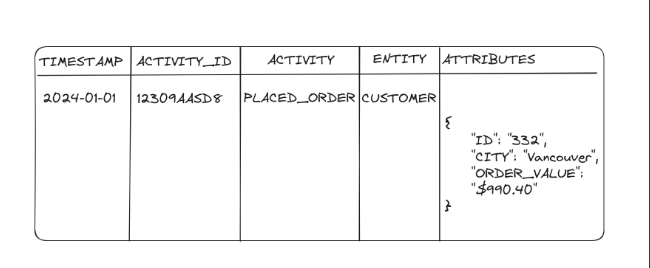
Here, we have defined the columns for the Activity-Schema
- timestamp - is the Date and Time of occurred activity;
- activity_id - is the unique identifier;
- activity - is the topic or nature of data;
- entity - is the subject of an activity
- attributes - is the set of key / value pairs that belogs to the entity
Now let's take a look at our table with this line of code
DESCRIBE TABLE activity.stream
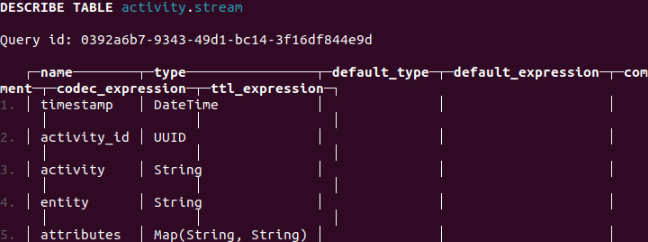
The Activity-Schema is now ready to ingest some data.
Extracting Data From Google Analytics
Now that we have created our stream table in Activity-Schema, let's ingest some data. I'd use Google Analytics API to ingest the events that are coming to my blog. In order to do that I open a new Terminal to create a virtual environment like so
python3 -m venv .venv
then activating it using this ...
source .venv/bin/activate
and finally installing dependencies for API requests, and ClickHouse connections.
pip install google-analytics-data clickhouse-connect google-auth-oauthlib
from google.analytics.data_v1beta import BetaAnalyticsDataClient
from google.oauth2 import service_account
from google.analytics.data_v1beta.types import (
    DateRange,
    Dimension,
    Metric,
    RunReportRequest,
)
import clickhouse_connect
import pandas as pd
from datetime import date, timedelta
from typing import Dict, Any

# Defining key to access our GA4 project
KEY = 'key.json'

# Defining main function to access GA4 data
def extract_data(property_id='4#12$6&0%', key_file_path=KEY):
    # Defining creadentials with our KEY
    credentials = service_account.Credentials.from_service_account_file(
        key_file_path,
        scopes=["https://www.googleapis.com/auth/analytics.readonly"]
    )

    # Creating client instance
    client = BetaAnalyticsDataClient(credentials=credentials)

    # Using RunReportRequest to define what we want from Google
    request = RunReportRequest(
        property=f"properties/{property_id}",
        dimensions=[
            Dimension(name='date'),
            Dimension(name='sessionDefaultChannelGroup'),
            Dimension(name='country'),
        ],
        metrics=[
            Metric(name="sessions"),
            Metric(name="activeUsers"),
            Metric(name="engagedSessions"),
            Metric(name="bounceRate"),
        ],
        date_ranges=[DateRange(start_date='2024-01-01', end_date=f'{date.today() + timedelta(days = -1)}')],
        limit=row_limit
    )

    # Main code that runs report and saves the values into the rows[]
    try:
        response = client.run_report(request)

        rows = []
        for row in response.rows:
            rows.append([
                row.dimension_values[0].value,
                row.dimension_values[1].value,
                row.metric_values[0].value,
                row.metric_values[1].value,
                row.metric_values[2].value,
            ])

        columns = ['date', 'channel', 'sessions', 'activeUsers', 'engagedSessions']
        df = pd.DataFrame(rows, columns=columns)
        df = df.sort_values(by=['date'])
        df['date'] = pd.to_datetime(df['date'])

        # Printing our metrics in the console before returning it
        print(df)
        return df

    except Exception as e:
        print(f"Error: {e}")

# Calling our function, should be removed in the next Transform step
extract_data()
By running this script we return the DataFrame of our traffic like so
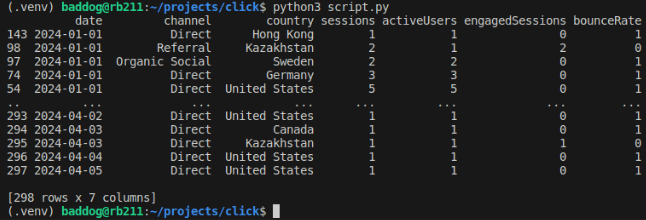
Be aware that you won't be able to access my blog's data, since you don't have credentials to access it, so you might want to refactor this script to access any other data available to you.
Transforming Data into Activity Schema
As you may see, the returned DataFrame consist of 7 columns and 298 rows, it's not exactly the Big Data, but that's a good sample for us to play around with. Now our task is to transform this Data into a format that would fit into Activity-Schema that has only 5 columns. Let's do it with pandas
"""
Remove the last line of code from previous script
Which is calling extract_data() function
Replace it with this block of code
To eliminate log prints
"""
import pandas as pd
from typing import Dict, Any
# This function help to convert any incoming Data Type into the String
def convert_data_to_string(dictionary: Dict[Any, Any]) -> Dict[str, str]:
return {k: str(v) for k, v in dictionary.items()}
# Main transform function
def transform_data(df=extract_data()) -> pd.DataFrame:
df['activity'] = 'INCOMING_TRAFFIC'
df['timestamp'] = df['date']
df['entity'] = df['country']
df['attributes'] = df[
['channel', 'sessions', 'activeUsers', 'engagedSessions', 'bounceRate']].to_dict(orient='records')
df = df[['timestamp', 'activity', 'entity', 'attributes']]
df.loc[:, 'attributes'] = df['attributes'].apply(lambda x: convert_data_to_string(x))
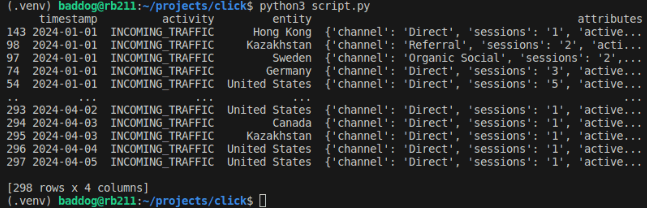
print(df)
return df
transform_data() # This line also should be removed in the Load step
Running above script creates a new column called activity, and by default it populates with "INCOMING_TRAFFIC" value, as this batch of data is about incoming traffic, some other columns like date and country has been renamed to comply the ClickHouse table we created earlier. And finally we created attributes column, that takes the rest of the data like channel source, sessions numbers etc ...
Loading Data into ClickHouse
"""
    Same as before
    Remove transform_data() lines
    With the following script to avoid console noise
"""

def load_data(df=transform_data()):

    # initiate client
    client = clickhouse_connect.get_client(host='localhost', username='default', password='')

    # Execute insertion command
    client.insert('activity.stream', df, column_names=['timestamp', 'activity', 'entity', 'attributes'])

    # Close ClickHouse connection
    client.close()
    print("DataFrame has been uploaded into Activity-Schema")

load_data()
To check if the Data has been loaded, let's get back to the ClickHouse Client Terminal and count the number of rows by running the following SQL script.
SELECT count() FROM activity.stream
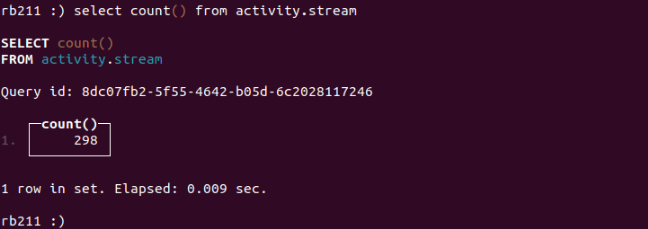
We have ingested Google Analytics Data into Activity-Schema, now let's see how to access attributes data, imagine that we are interested in total sessions by country.
SELECT
    entity,
    SUM(CAST(attributes['sessions'], 'UInt64)) as sessions_total
FROM activity.stream
GROUP BY entity
ORDER BY sessions_total DESC
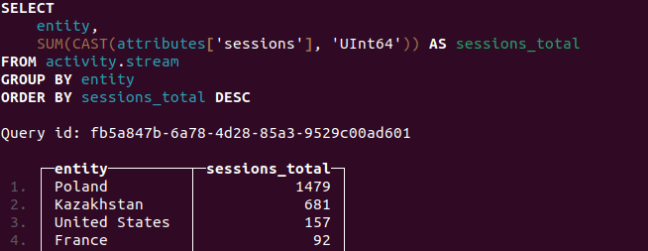
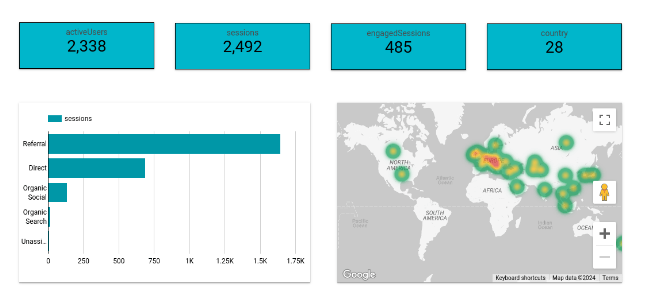
And there you have it! The Data Warehouse in Activity-Schema ready to store millions rows of data under different activity that can be self-joined via timestamp, entity or attributes. Here, I have built a simple report on sessions by channels and countries.
Conclusion
In this article we have discussed OLTP vs OLAP databases, also talked about the differences between the Star-Schema and Activity-Schema. Further we have setup the ClickHouse environment and created activity.stream table. Next, we extracted Google Analytics data, transformed it into the Activity-Schema format, and finally uploaded it to our Data Warehouse named activity.stream.
If you want to dive into Data Warehousing, then you should learn MPP or Massive Parallel Processing. MPP is the technical approach to set your OLAP database to ingest data from different shards, which is the separate units of clustered CPU working in parallel and then sharing the processed data with one another. Pretty cool stuff!
Another point to keep in mind is that in this article, we have performed ETL mannually. And a crucial skill in Data Analytics and Engineering is to be able to automate this workflow. For that purpose the Data Orchestration tools like Apache Airflow is very useful. We will cover it in the next articles, very soon.
I hope you have enjoyed reading this article !
Yours,
Bad Dog